How Walkable is Frankfort, IL?
Among the lowest Walk Scores in Chicagoland belongs to Frankfort, at just 19 out of 100. Yet with a median sale price of $629,585, it's also one of the most expensive communities measured here. Buyers are not purchasing walkability in Frankfort.

Walkability in the Chicago area
Frankfort has a Walk Score of 19; the metro average of 77 is four times higher. Even nearby Mokena (23) and New Lenox (24) score a few points above, while Tinley Park (35) at 35 offers notably more pedestrian access.
No Metra station serves Frankfort directly, though the Rock Island line has stops in nearby New Lenox and Mokena. La Grange Road and Route 30 are the primary commercial corridors, both auto-oriented with setback retail plazas. Frankfort's Old Plank Road Trail provides recreational cycling but connects to commercial areas only incidentally.
What a Walk Score of 19 means
Frankfort's Walk Score of 19 places it in the "Almost All Errands Require a Car" category. Daily life is entirely car-dependent. Grocery runs, dining out, and errands all involve driving. No public transit serves the village for everyday use. The bike score of 44 (Minimal Bike Infrastructure) reflects trail access for recreation only.
Why do buyers choose Frankfort?
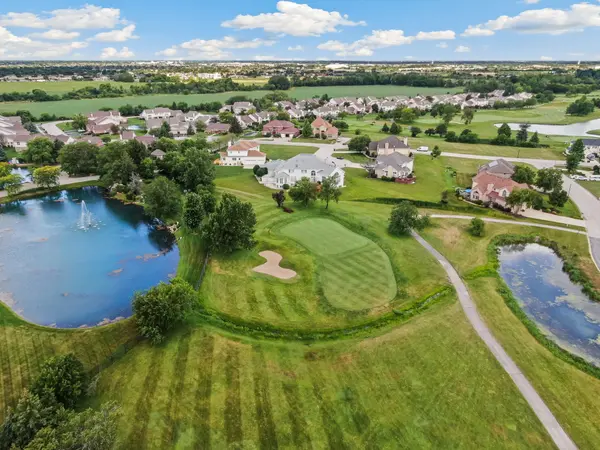
Frankfort buyers are purchasing large-lot residential living at a premium price. At $629,585, it costs more than walkable Evanston ($484,757) despite scoring 56 points lower on walkability. About 30% of homes sell above asking, fewer than most areas in this batch, and listings take a median of 50 days to sell. The market is less competitive than tighter suburbs, with 2.8 months of supply giving buyers more negotiating room.
The tradeoff is stark: buyers choose maximum residential space and privacy over any form of walkability. Frankfort's appeal is acreage-style lots, newer construction, and a quiet setting. For the same money, a buyer could have Evanston's 76 Walk Score, Naperville's Metra access at $631,684, or multiple walkable Chicago neighborhoods. Frankfort buyers have deliberately opted out of pedestrian living in favor of a rural-suburban character within commuting distance of the city.
| Location | Walk Score | Bike Score | Transit Score | Median sale price | Days on market |
|---|---|---|---|---|---|
| Frankfort | 19 | 44 | -- | $629,585 | 50 days |
| Round Lake | 20 | 39 | -- | $332,334 | 43 days |
| Bartlett | 22 | 49 | -- | $442,279 | 42 days |
| Mokena | 23 | 37 | -- | $518,041 | 43 days |
| New Lenox | 24 | 41 | -- | $457,271 | 42 days |
| Algonquin | 26 | 49 | -- | $414,792 | 47 days |
Limited to neighborhoods with at least 10 home sales in the period.
All data comes from Redfin and represents a three-month rolling average ending July 2026. This article has been generated, in whole or in part, using generative artificial intelligence (AI) technology, with input from Redfin head of economics research Chen Zhao. While efforts have been made to ensure the accuracy and reliability of this information, you should independently verify all data, facts, and citations contained in this article before relying on it for any purpose. This information is not a substitute for advice from a real estate agent, financial advisor, or other licensed professional. Check the Redfin Data Center for additional in-depth housing market data.
Categories
Recent Posts